
Marketing attribution models are the rules a business uses to decide which touchpoint — which ad, email, blog post, or sales call — gets credit when a customer finally converts. Get the model wrong and you’ll systematically over-fund the channels that happen to sit last in the journey (usually branded search and retargeting) while starving the channels that actually introduce customers to you in the first place. There is no single “correct” model; different models answer different questions, and most mature marketing teams use more than one at once, for different decisions.
This article walks through every major attribution model in plain terms, shows how the same customer journey gets credited completely differently depending on which model you pick, and covers what’s genuinely changed in attribution over the past few years as third-party cookies and mobile tracking IDs have become unreliable.
What Marketing Attribution Actually Measures
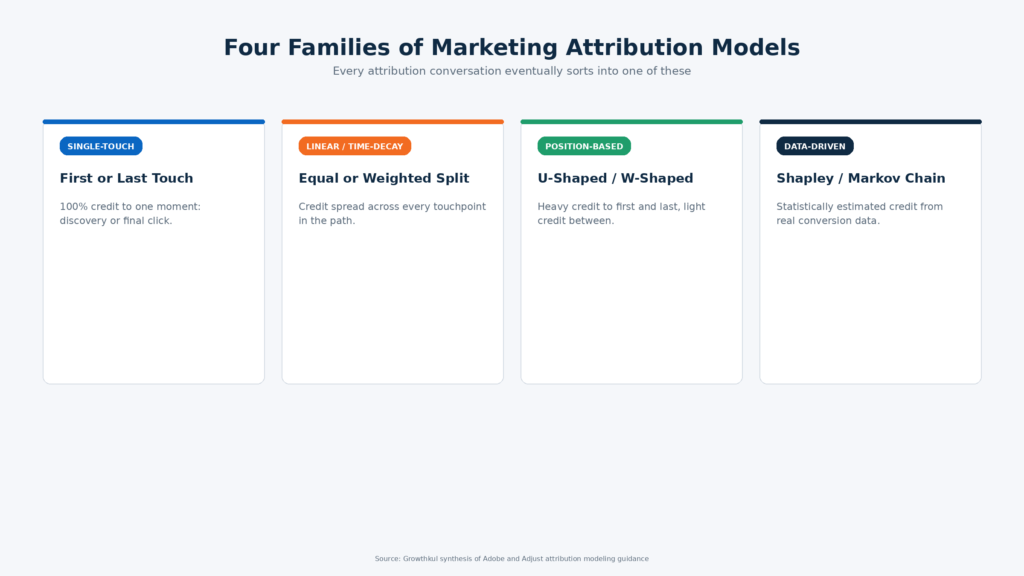
At its core, attribution modeling assigns credit — full or partial — to the touchpoints a customer interacted with before converting. Adobe frames the fundamental split clearly: attribution models fall into single-touch models, which give full credit to one step in the journey, and multi-touch models, which split credit across multiple steps. Everything else is a variation on that basic choice.
The practical reason this matters is budget allocation. If your reporting shows that paid search drove 80% of conversions, you’ll naturally shift more budget there — but if that number comes from a last-touch model, it’s almost certainly overstating paid search’s real role, because last-touch credits whichever channel happened to be clicked right before conversion, regardless of what actually built the customer’s interest over the preceding weeks.
This isn’t a purely academic distinction. Marketing teams that rely on a single, poorly-chosen attribution model tend to make a predictable, compounding mistake: they defund the channels that build awareness and consideration (content, organic social, early-stage display) because those channels rarely appear as the final click, and they over-invest in channels that happen to sit at the bottom of the funnel (branded search, retargeting) because those channels almost always do. Over several budget cycles, this can quietly starve the very activity that was generating demand for the bottom-funnel channels to capture in the first place — a trap that’s easy to fall into precisely because each individual budget decision, viewed through a last-touch lens, looks locally rational.
A four-card overview of the main families of marketing attribution models The four broad families most attribution conversations eventually sort into
Single-Touch Models: First-Touch and Last-Touch
These are the simplest models, and still the most widely used, largely because they require the least sophisticated tracking infrastructure.
First-touch attribution gives 100% of the credit to the very first interaction a customer had with your brand — the ad they first clicked, the blog post that first brought them to your site. Adobe notes this model is useful for understanding which channels introduce customers, not what ultimately moved them to act. It’s the right lens for evaluating top-of-funnel awareness channels, but it will make every other touchpoint in the journey look worthless, which is rarely an accurate picture of what actually closed the deal.
Last-touch attribution gives 100% of the credit to the final interaction before conversion — often a branded search click, a retargeting ad, or a direct visit. This remains, in practice, the default model for a huge share of marketing measurement, particularly in mobile app marketing: Adjust, a major mobile measurement partner, explicitly states that last-touch attribution is the current industry standard for mobile measurement, despite its well-known limitations. Last-touch is simple, cheap to implement, and hard to game accidentally — but it systematically undervalues every channel that builds interest earlier in the journey.
Multi-Touch Attribution Models
Multi-touch models exist precisely to address single-touch attribution’s core weakness: real customer journeys, especially for considered purchases, rarely involve just one meaningful interaction. A buyer might see a social ad, later read a comparison article, attend a webinar, and only then click the email that triggers the final purchase — a single-touch model forces you to pretend only one of those four moments mattered, when in reality each likely played some role. Multi-touch models split credit across several touchpoints rather than awarding it all to one, and come in a few standard flavours:
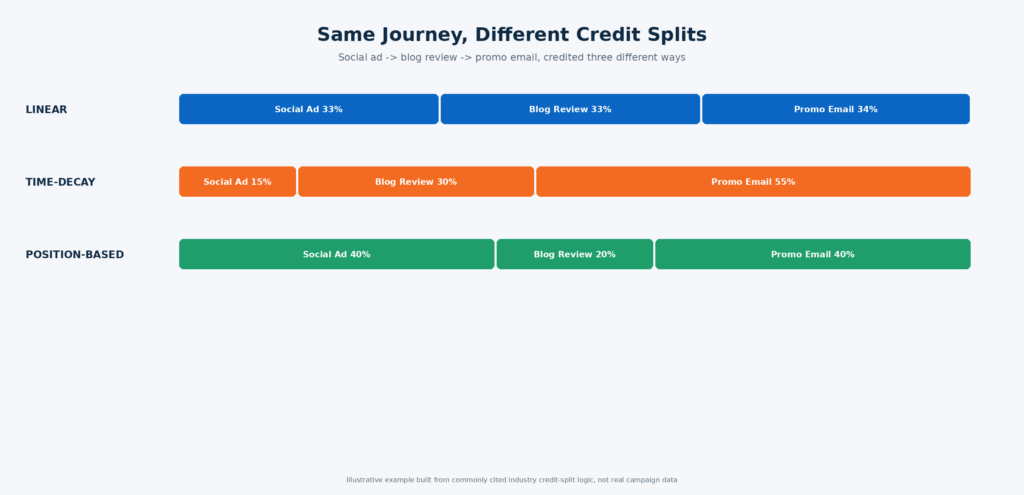
- Linear attribution splits credit equally across every touchpoint in the journey. A common illustrative example: a buyer who sees a social ad, reads a third-party blog review, and clicks a promotional email before purchasing would see each of those three touchpoints credited roughly 33.3%. It’s the simplest multi-touch model and a reasonable default when you have no strong reason to weight any stage more heavily.
- Time-decay attribution weights credit toward touchpoints closer to the conversion, on the logic that recency correlates with influence. In the same three-touchpoint example, the promotional email would receive the most credit, the blog review somewhat less, and the initial social ad the least — the opposite emphasis to first-touch, but less extreme than last-touch.
- Position-based (U-shaped) attribution gives heavy credit — commonly 40% each — to the first and last touchpoints, with the remaining credit split thinly across everything in between. This reflects a view that discovery and final conversion both matter most, while middle-funnel touchpoints play a supporting role.
- W-shaped attribution extends the same logic further, giving meaningful credit to three key moments — first touch, lead creation, and the opportunity/conversion stage — which is common in B2B models with a defined sales-qualified-lead stage.
A horizontal comparison showing how linear, time-decay, and position-based models split credit differently across the same journey The same three-touchpoint journey, credited four different ways
Data-Driven (Algorithmic) Attribution
The most sophisticated tier doesn’t use fixed rules at all. Data-driven, or algorithmic, attribution uses statistical or machine-learning methods — commonly Shapley value calculations (borrowed from cooperative game theory) or Markov chain modeling — to estimate each touchpoint’s actual incremental contribution to conversion, based on patterns across your full dataset of converting and non-converting paths, rather than applying a fixed rule like “40% to the first touch” regardless of what the data shows.
This is the model Google Analytics 4 now defaults to for eligible accounts, and it’s generally considered more accurate than any fixed-rule model — but it comes with real costs: it requires a large volume of conversion data to produce stable results, it’s effectively a black box (you can see the output weighting but not easily audit the underlying logic the way you can with a linear or time-decay rule), and smaller businesses with lower conversion volumes often don’t have enough data for it to perform meaningfully better than a simpler rule-based model.
The Shapley value approach, specifically, borrows a concept from cooperative game theory originally developed to answer a different question entirely: how should a shared payoff be fairly divided among players who contributed different amounts to a joint outcome. Applied to marketing, each touchpoint is treated as a “player,” and the model calculates its average marginal contribution across every possible ordering of the touchpoints that led to conversion — a computationally intensive but theoretically well-grounded way of answering “how much did this specific touchpoint actually matter.” Markov chain approaches take a different statistical route, modelling the customer journey as a series of probabilistic state transitions and then calculating each channel’s “removal effect” — essentially asking how much conversion probability would drop if that channel were taken out of the mix entirely. Both approaches require considerably more data and computational infrastructure than any of the fixed-rule models, which is why they tend to show up in enterprise-grade analytics platforms rather than lightweight reporting tools.
Which Model Should You Actually Use? A Decision Table
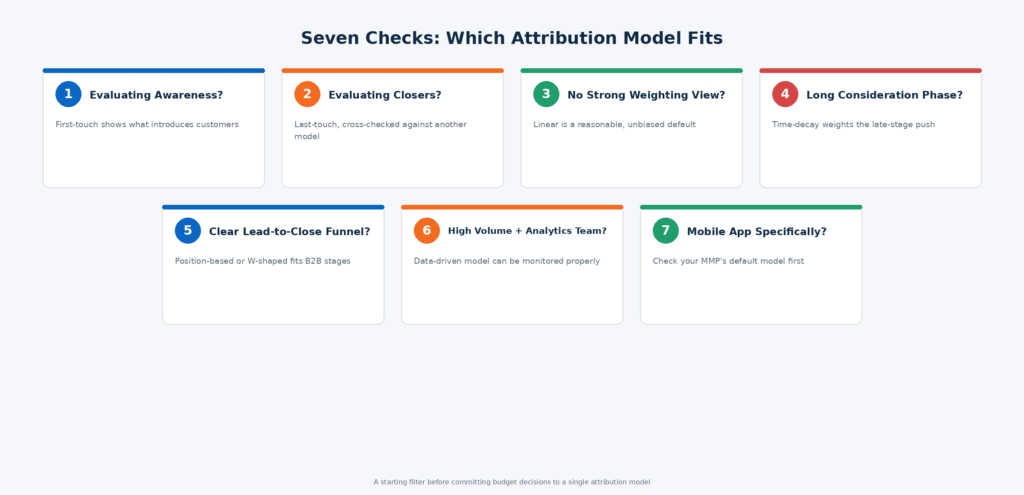
A seven-step grid of checks for deciding which attribution model fits your situation Work through these before committing a budget decision to one model
| Your situation | First thing to check | Likely right model |
|---|---|---|
| You’re evaluating top-of-funnel awareness channels | Do you need to know what introduces customers to you? | First-touch |
| You’re evaluating bottom-funnel conversion channels (retargeting, branded search) | Do you need to know what closes deals? | Last-touch, but cross-check against another model |
| You have no strong view on which stage matters most | Is simplicity more valuable than precision right now? | Linear |
| Your sales cycle is long, with a clear late-stage consideration phase | Does the final nudge genuinely matter more than early discovery? | Time-decay |
| You have a defined lead-to-opportunity funnel (common in B2B) | Do first touch, lead creation, and close all matter distinctly? | Position-based or W-shaped |
| You have high conversion volume and a data/analytics team to interpret it | Can you commit to ongoing monitoring of a black-box model? | Data-driven / algorithmic |
| You’re on mobile app marketing specifically | Does your mobile measurement partner default to one model already? | Check — many default to last-touch |
This table reflects common practice, not a universal rule — many marketing teams run two models side by side (commonly last-touch for day-to-day optimisation and a multi-touch or data-driven model for quarterly budget reviews) rather than committing to just one.
A Worked Example: One Buyer Journey, Four Different Credit Splits
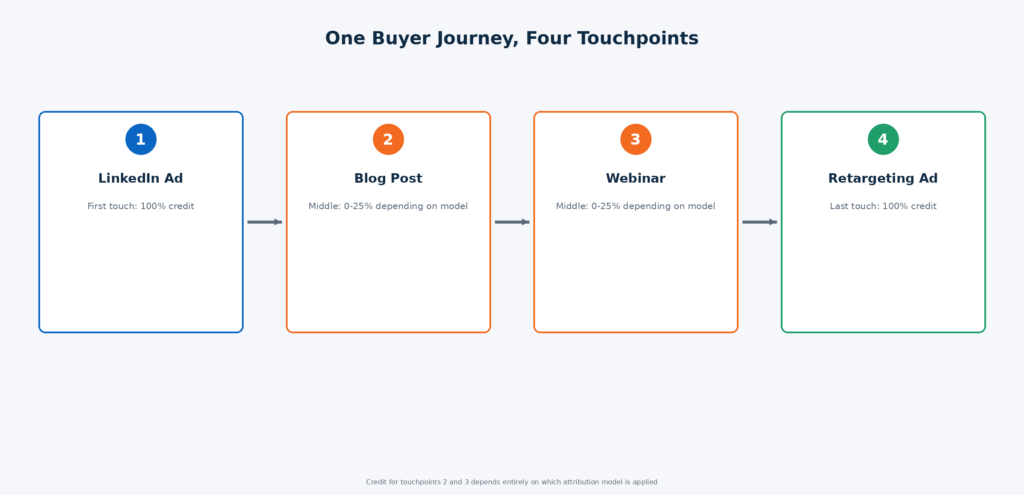
Take a hypothetical B2B SaaS buyer’s journey: they see a LinkedIn ad (Touchpoint 1), read a comparison blog post two weeks later (Touchpoint 2), attend a webinar a week after that (Touchpoint 3), and finally convert after clicking a retargeting ad (Touchpoint 4). Here’s how four different models would credit a single conversion worth, say, ₹1,00,000 in deal value:
| Model | LinkedIn Ad | Blog Post | Webinar | Retargeting Ad |
|---|---|---|---|---|
| First-touch | ₹1,00,000 (100%) | ₹0 | ₹0 | ₹0 |
| Last-touch | ₹0 | ₹0 | ₹0 | ₹1,00,000 (100%) |
| Linear | ₹25,000 (25%) | ₹25,000 (25%) | ₹25,000 (25%) | ₹25,000 (25%) |
| Position-based (40/20/20/40, adjusted) | ₹40,000 (40%) | ₹10,000 (10%) | ₹10,000 (10%) | ₹40,000 (40%) |
Notice that LinkedIn ads look either completely worthless (last-touch) or solely responsible for the entire deal (first-touch), depending purely on which model you chose — nothing about LinkedIn’s actual contribution changed between those two rows. This is the central, practical reason attribution model choice matters more than most marketing teams initially assume: the same campaign data can justify either cutting a channel’s budget to zero or doubling down on it, depending solely on which model produced the report.
This example is illustrative, built to demonstrate how credit splits shift across models — real customer journeys are typically longer and messier, and actual percentage splits from any real model depend on your specific data and the exact variant of each model you implement.
A four-stage flow diagram of a buyer journey showing how different touchpoints earn credit under different models The same journey, radically different credit depending on the model applied
A Myth Worth Correcting: “Last-Touch Attribution Is Obsolete”
A claim that circulates often in marketing-analytics content is that last-touch attribution is an outdated relic that no serious marketer should still use. This oversimplifies the real picture. Last-touch has genuine, well-documented weaknesses — it ignores everything that happened before the final click — but it isn’t obsolete in practice: Adjust, speaking specifically to the mobile app industry, describes last-touch as the current industry standard, not a legacy approach being phased out. It persists because it’s simple to implement, doesn’t require stitching together cross-device or cross-session data, and is harder to argue with internally than a multi-touch model whose exact weighting can feel arbitrary to stakeholders who don’t trust the underlying math.
The more defensible position: last-touch remains a reasonable default for operational, day-to-day campaign optimisation — deciding which specific ad creative or keyword to pause this week — while multi-touch or data-driven models are better suited to strategic, quarterly-or-longer budget allocation decisions across channels. Treating last-touch as categorically wrong, rather than situationally limited, throws away a genuinely useful tool for the wrong reason.
What’s Changed Recently: The Privacy-Driven Shift
Attribution has been reshaped significantly over the past several years by privacy changes that make detailed, user-level tracking harder:
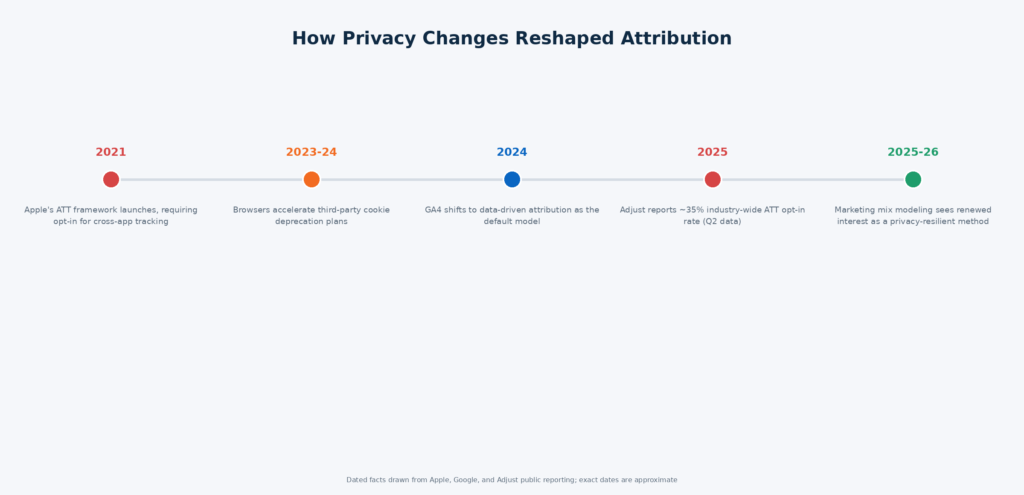
- Apple’s App Tracking Transparency (ATT) framework, which requires apps to explicitly ask permission before tracking users across other apps and websites, has sharply reduced the share of users who can be tracked at the individual level. Adjust’s own Q2 2025 data puts the industry-wide ATT opt-in rate at roughly 35%, meaning the majority of iOS users now opt out of the tracking that traditional multi-touch attribution relies on.
- Third-party cookie deprecation in browsers has had a similar effect on web attribution, pushing many marketing teams toward first-party data collection and consent-based tracking rather than the cross-site tracking older attribution models assumed was available.
- Google Analytics 4’s shift to data-driven attribution as the default model for eligible properties reflects the broader industry move away from fixed-rule models toward statistical approaches that can work with incomplete, probabilistic data rather than requiring a complete, deterministic path for every converting user.
- Marketing mix modeling (MMM) has seen renewed interest as a privacy-resilient alternative, precisely because it works at the aggregate, channel-and-time-period level rather than requiring individual user-level tracking — it answers a different, more macro question than multi-touch attribution, but it doesn’t break when tracking IDs disappear.
The practical upshot: attribution today increasingly combines probabilistic, aggregate methods (MMM, data-driven modeling) with whatever deterministic tracking remains available, rather than relying purely on the clean, fully-tracked user journeys that older multi-touch models were originally designed around.
A timeline of dated facts showing how privacy changes have reshaped marketing attribution over recent years Why attribution models have had to adapt to less complete tracking data
India-Specific Notes
A few points worth flagging specifically for Indian marketing teams, since attribution tooling and typical setups here can differ from the largely US/EU-centric sources most comparison content draws from:
- GA4 adoption timelines in India lagged somewhat behind US/EU markets, meaning a meaningful share of Indian businesses are still working with simpler last-click reporting inherited from legacy Universal Analytics setups, even though GA4’s data-driven attribution has been the default for eligible accounts for some time now — it’s worth specifically checking which model your GA4 property is actually using, since older or lower-traffic properties sometimes fall back to a simpler rule-based model.
- India’s mobile-first market makes ATT opt-in rates and mobile attribution particularly significant. With a large share of D2C and app-based conversions happening on mobile, the industry-wide shift toward lower tracking visibility affects Indian app marketers at least as much as, and often more than, web-first businesses.
- Performance marketing agencies serving the Indian market commonly blend last-touch platform reporting (Google Ads, Meta Ads) with a separate multi-touch or data-driven view, precisely because platform-native reporting from Google and Meta tends to over-credit their own channel — a well-documented bias worth factoring in when comparing in-platform numbers against a neutral third-party attribution tool.
- For B2B companies in India with longer, relationship-driven sales cycles (common in enterprise SaaS, manufacturing, and industrial sales), position-based or W-shaped models often map more naturally onto the real sales process — first touch, marketing-qualified lead, sales-qualified lead, close — than either single-touch extreme.
Cadence Checklist: Reviewing Your Attribution Setup
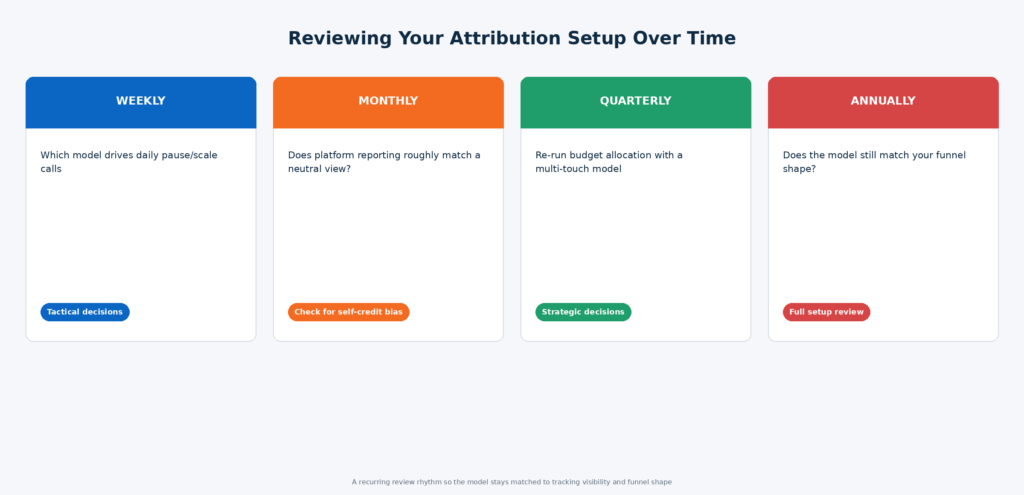
A four-column cadence checklist for reviewing your attribution model over time A recurring review rhythm so the model stays matched to reality
| Cadence | What to check | Why it matters |
|---|---|---|
| Weekly | Which model is driving day-to-day campaign pause/scale decisions | Usually last-touch or platform-native; fine for tactical calls |
| Monthly | Does in-platform reporting (Google/Meta) roughly agree with a neutral attribution view? | Platform self-reporting tends to over-credit itself |
| Quarterly | Re-run budget allocation using a multi-touch or data-driven model | Strategic decisions deserve a model beyond last-touch |
| Every 6 months | Has tracking visibility (ATT opt-in, cookie availability) changed meaningfully? | Privacy shifts can silently degrade model accuracy |
| Annually | Is your current model still matched to your actual sales funnel shape? | A funnel that’s grown longer or shorter may need a different model |
One-Page Summary: Attribution Models at a Glance
| Model | Credit given to | Best for | Main limitation |
|---|---|---|---|
| First-touch | 100% to the first interaction | Evaluating awareness/discovery channels | Ignores everything that closed the deal |
| Last-touch | 100% to the final interaction | Day-to-day tactical optimisation | Ignores everything that built initial interest |
| Linear | Equal split across all touchpoints | Simple, unbiased default | Treats every touchpoint as equally important, which is rarely true |
| Time-decay | More credit to later touchpoints | Long sales cycles with a late-stage push | Still somewhat arbitrary in its exact weighting |
| Position-based | Heavy credit to first and last, light in between | Funnels with clear discovery + close stages | Middle-funnel nurture work still undervalued |
| Data-driven / algorithmic | Statistically estimated per touchpoint | High-volume accounts with analytics capacity | Requires large data volume; harder to audit |
Conclusion
There’s no universally “correct” marketing attribution model — first-touch, last-touch, linear, time-decay, position-based, and data-driven models each answer a different question, and the right choice depends on whether you’re making a fast tactical call or a strategic budget decision. What matters more than picking the perfect model is understanding what any model you use is systematically over- or under-crediting, and cross-checking major budget decisions against more than one view before you shift significant spend. If you’re trying to get this right across a real channel mix rather than in the abstract, Growthkul’s best performance marketing agency team builds attribution reporting around your actual funnel and sales cycle, not a one-size-fits-all default. Whichever model you start with, revisit it as your tracking visibility and funnel shape change — the model that was right for your business two years ago may already be quietly misleading you today.
